
THRE3D, previously covered on 3DPI, is both an extensive 3D printing directory and webstore for purchasing 3D printing goods. With their polished design and numerous entries, it’s clear that the site knows what it’s doing. And their latest project demonstrates that THRE3D wants to be your go-to reference for every printer on the market. The site is in the process of publishing their 3D printer comparison tool, which charts various machines against one another in a wide range of categories, to help you visualize how they all stack up.
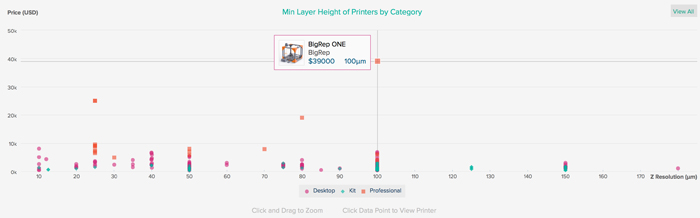
The tool, currently in beta testing, is made up of a series of charts that measure all of the 3D printers in the THRE3D directory using most of the criteria you’d probably be interested in. Want to know which 3D printer has the best Z-axis layer thickness for its price? Well, that’d probably be the OWL Nano, a stereolithography machine that boasts layer heights of .1 microns. What about build volume? What’s the biggest printer I can get for the least amount of money? For about $9,500, you can purchase the iDeator 24, with build dimensions of 711.2 x 711.2 x 609.6 mm. For about 4x that price, you could also buy the BigRepOne, which has a massive build volume of 1147 x 1000 x 1188 mm.
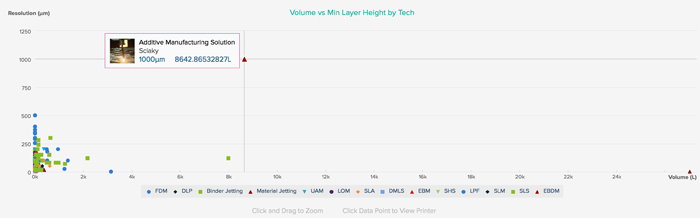
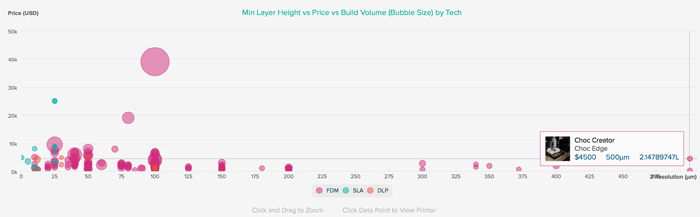
Then, there are charts visualizing the number of 3D printer manufacturers per country, layer heights by 3DP technology (FFF vs. SLA vs. DLP), and even layer height by price by build volume, so that you know which printer can print the largest, most highly detailed Yoda bust at the lowest price. Of course, the comparison tool isn’t complete and neither is the THRE3D directory, so you won’t see any house printers on the site, yet. With the ability to zoom into their charts and click on data points to learn more about the specs of each 3D printer, the tool is shaping up to be pretty handy.
And, because the visualization tools are still in beta, THRE3D wants your feedback! Myles Lambert, the company’s CEO, has already heard a few things. Here’s what he tells me:
A couple heavily improved charts, with a whole page dedicated to them including explanations and insights about what’s tracked and highlighting/identifying popular products to serve as benchmarks, would be useful for people interested in getting a 3D printer. On the other hand, having the ability to select your own parameters from the whole list of tech specs and get a list of results alongside the chart would make it much more useful for people in the industry who would like to use the dock for research. We’ve also been asked to display the information in formats such as bar charts, pie charts etc. so that they correspond better with the various questions they might answer.
Additionally, some of the feedback we’ve gotten has commented on how much more there is to a 3D printer than what its spec sheet can say to be visualized in a chart or graph. We definitely agree and realize we can’t answer all the questions somebody might have about a 3D printer such as reliability or ease of use with a graph based on specs. But let’s say they know they need an FDM printer with a big build volume, they could easily see what their options are (even more quickly than they can browsing the results on the website) and within a glance how their prices compare with the competition. From there they can go learn more about the particular products that fit their needs. The goal in this case is to save people as much time as possible in the research side of things.
Head over to the site and peruse the data. Then, when you get a spare moment, send Myles your thoughts at [email protected].
Source: THRE3D