Researchers at MIT have created LuminoCity, a 3D printed replica of the MIT campus that puts Twitter Big Data on display in real time using the new Twitter DecaHose data aggregator and MIT’s CLARITY air quality monitoring network.
Big Data is a blanket term for sets of information so large that it becomes exponentially more difficult to aggregate and process. As our world continues to advance technologically the amounts of data being generated have rapidly outpaced our ability to process it all manually. Automated data sorters like the Twitter DecaHose from Gnip can take the 500 million tweets a day that we generate, sort and filter them by subject, trend or any other data point that a user needs and then break it down into smaller and easier to understand blocks of information.
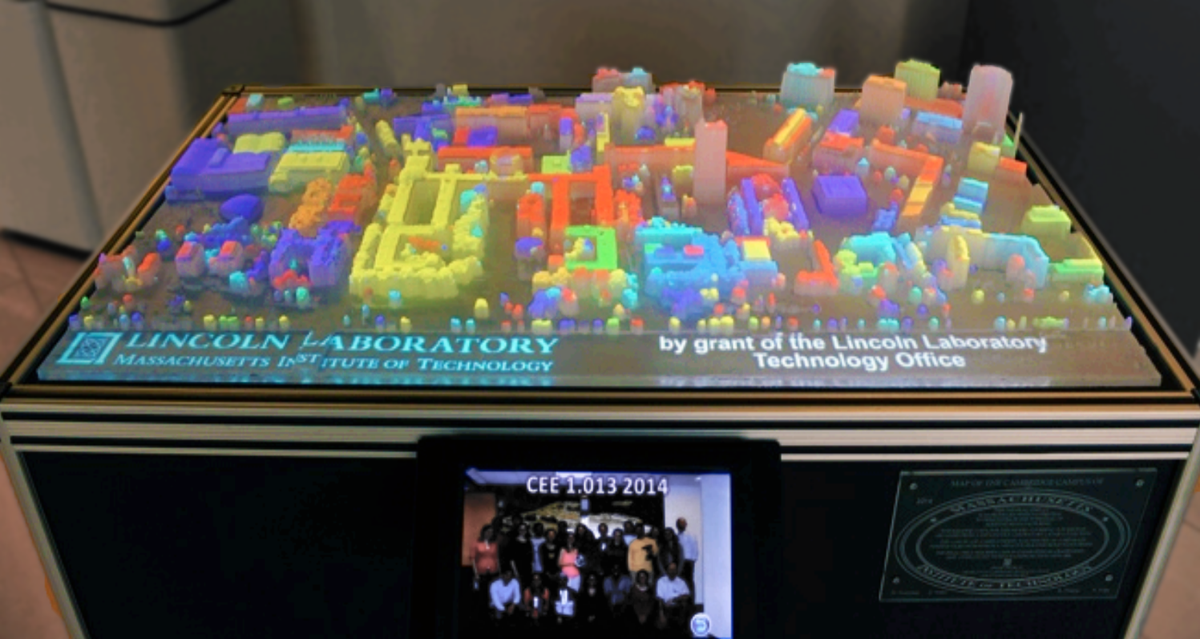
LuminoCity (PDF) is a 3D printed mock-up of the MIT campus that is outfitted with sensors and connected to a computer and LED lights that displays real time data that users can interact with. They can even change the parameters of what data is being displayed, and where it is being displayed.
Researchers Vijay Gadepally and Zachary Webe from MIT’s Lincoln Laboratory designed LuminoCity to show geo-tagged data, including Twitter information that has been processed through DecaHose. The system automatically parses the information and can display trending topics and the general location of topics of discussion. It can even show things like traffic delays in real time by analyzing the amount of people complaining about them at the location that they are experiencing it.
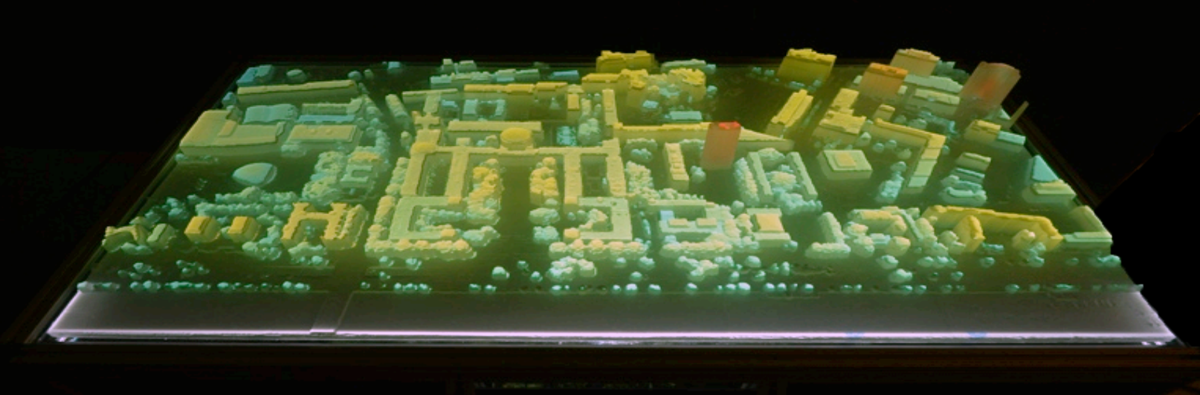
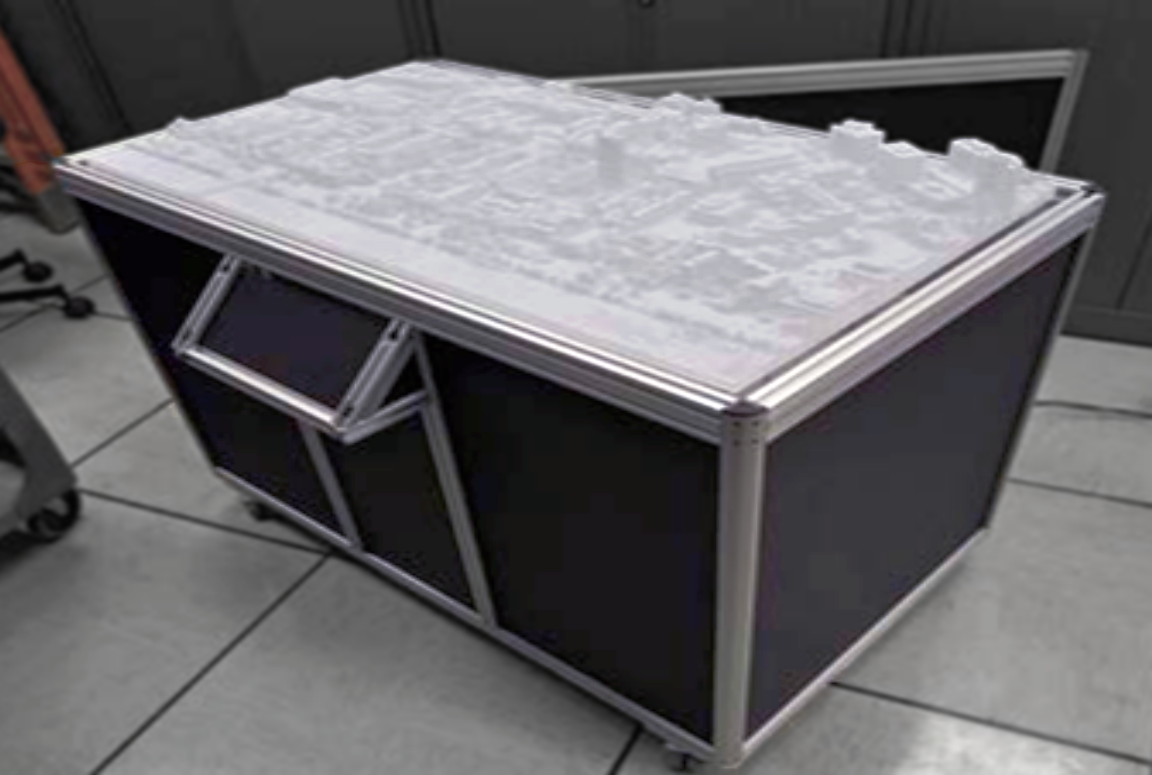 The LuminoCity model was 3D printed in a clear material so the LED lights could be easily seen and the shifts in color could be fully appreciated. Rather than display the information on a flat monitor, Gadepally and Webe used the three dimensional model to allow users to visualize the data in a way that is easier for the brain to comprehend and retain. Information visualisation is when visual tools are used to strengthen our ability to pull meaningful information from ambiguous or abstract sources. By representing Twitter data in real time within a three dimensional model, users are able to get a clearer picture of what the data means within the context of the environment that it is being generated.
Aside from social media data, LuminoCity also displays Big Data from another MIT project called CLARITY. The CLARITY project is a system of sensors distributed throughout the MIT campus put in place to monitor and examine airborne pollution and local air quality in real time. Much like the goal of LuminoCity, CLARITY’s purpose is to maintain perpetually updated data sets and turn it into accessible and easy to understand information specific to the users needs. The sensor nodes consist of a system that uses lasers to measures air particulate density, alpha-sense sensors that measure the concentration of pollutants, and a Raspberry Pi all contained in a 3D printed case to protect it from the elements.
For all the talk of privacy and the ways that social media and marketers exploit our personal data, the amount of information that programs like DecaHose can pull from our tweets and status updates is a little extreme. But as much as people complain about it, we still use social media. We still allow our data to be catalogued and stored, and the reality is, that is the price that we pay for access to “free” services like Facebook, Google and Twitter.
Big Data is here to stay, and the ability to mine that data into useful scripts of exploitable information is an inevitability. But as long as we’re generating this data, at least someone has found a way to extract useful information that has nothing to do with selling me things that I don’t need and can potentially be used to help everyone in real and meaningful ways.